Visual Management

Real-Time insights delivered through dynamic visualizations in physical spaces.
Solutions tailored to your organisation
New business? Long-standing company? We can help you at every stage of your development!
- Radical visibility improvement
- Instant KPI reporting
- Operational efficiency increasing
- Context-based reacting
-
See for Yourself
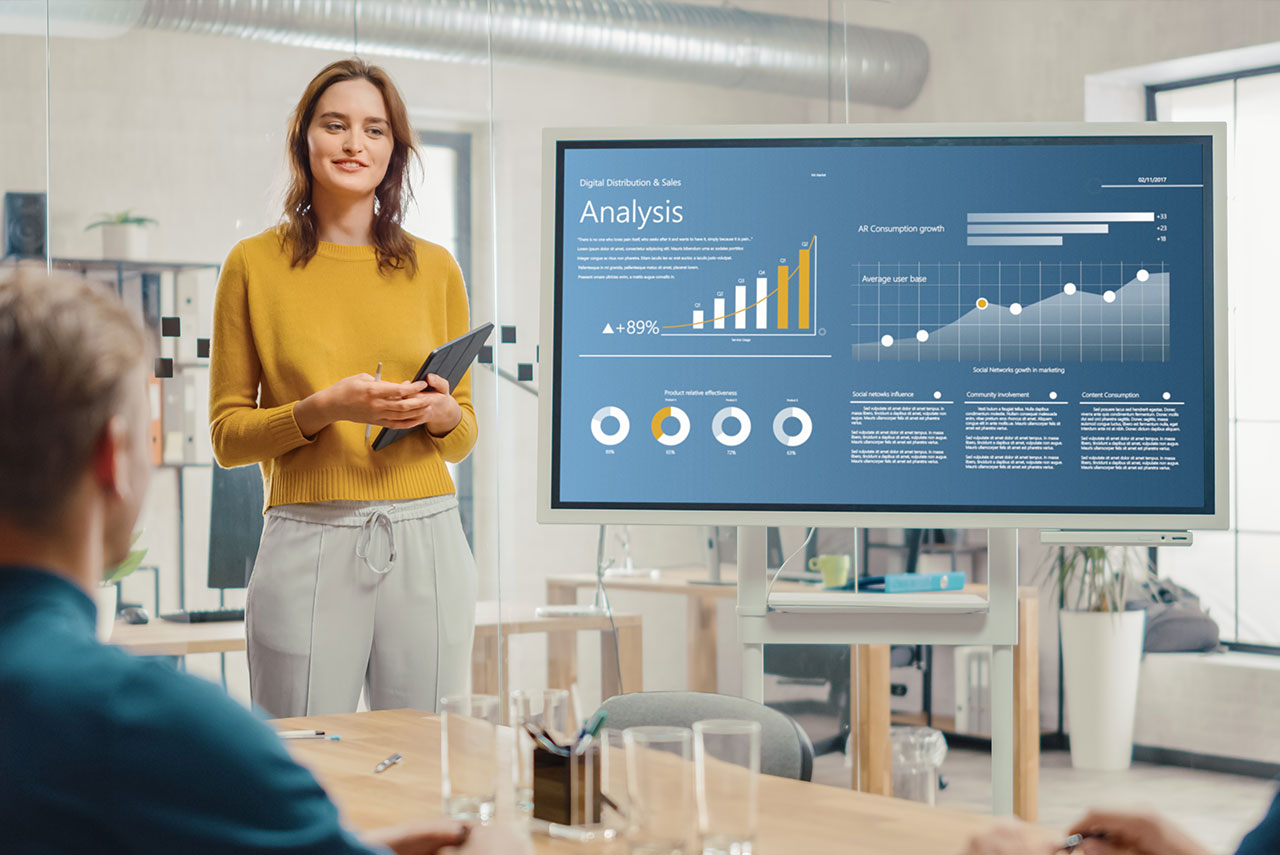
Thanks to a digital, centrally managed way of displaying data and information, we can significantly increase the transparency of business processes. We inform the right people, at the right time, and allow for the avoidance of misunderstandings resulting from a lack of information.
- Digital Signage systems greatly facilitate recall - 83% of respondents remember the content up to 3 days after seeing it.
- 13 milliseconds - that's how fast a human can recognize graphic information.
-
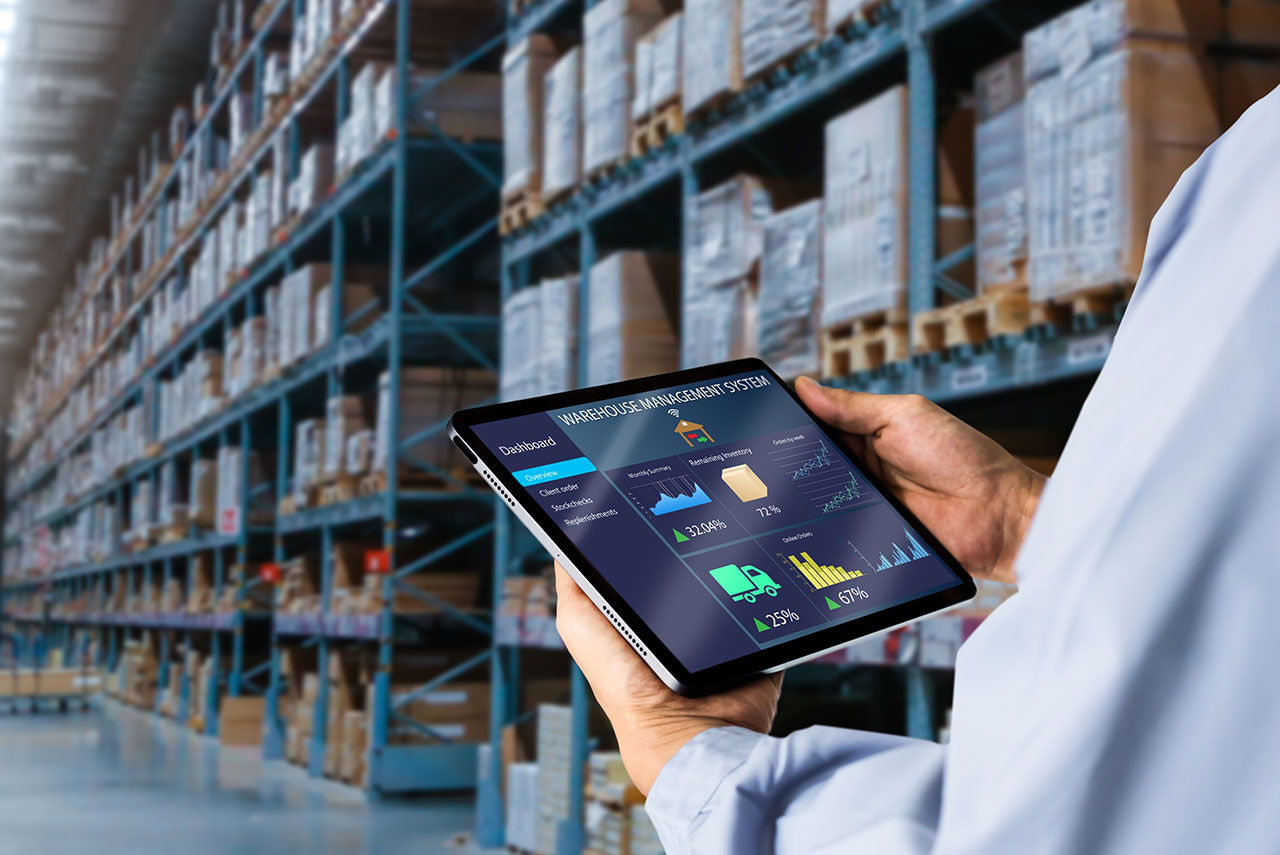
Digital Dashboard, Physical Benefits
By connecting our proprietary SIGNIO platform to data collection systems (sensors, devices, ERP systems), we can aggregate and easily present current plan execution.
- Studies indicate that 59% of people who were presented information via Digital Signage felt the need to explore the topic further.
- Digital content attracts the attention of 400% more viewers compared to printed content.
-
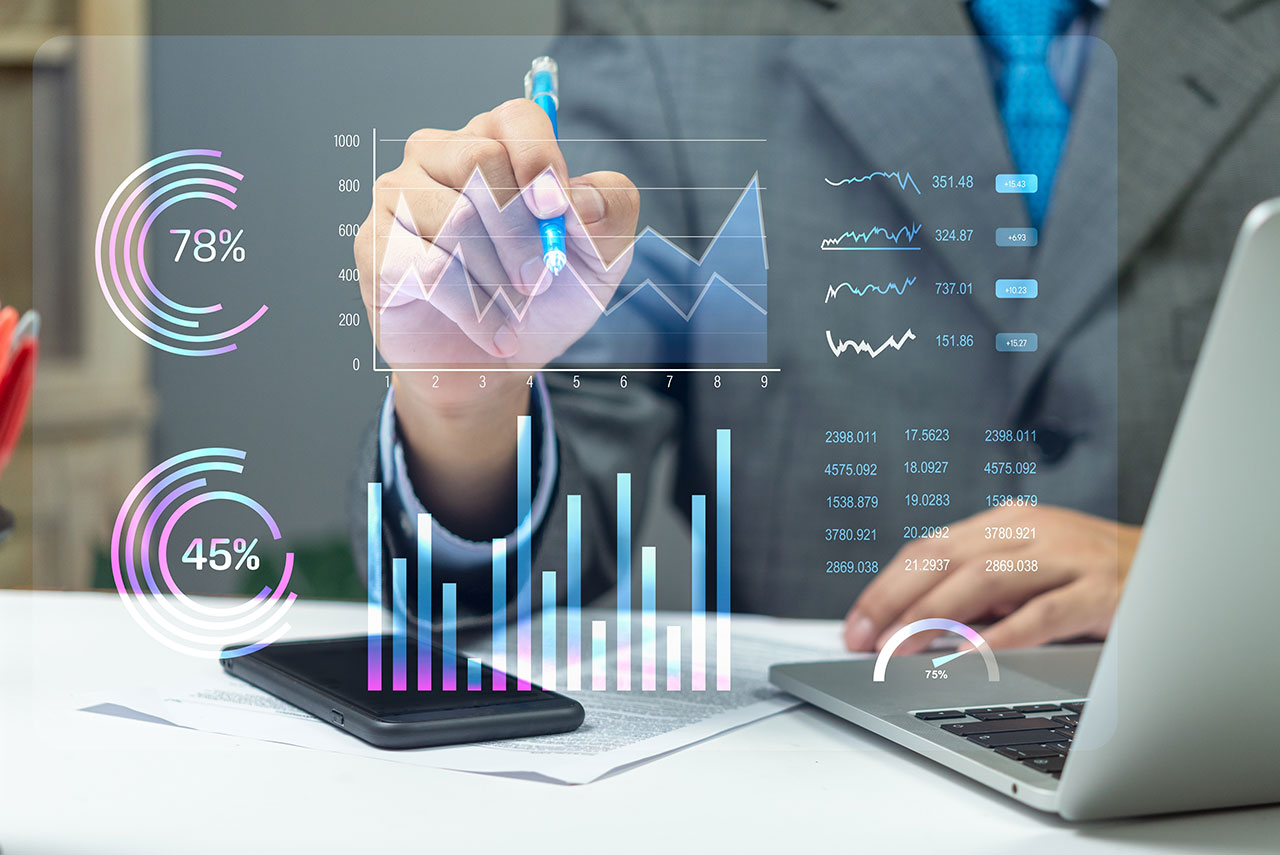
For Yesterday, For Right Now, For Sure
We free up resources through instant access to information: data/report/insight recipients do not waste valuable time collecting, processing, and presenting data. They focus solely on making decisions based on information prepared by our platform - SIGNIO.
- < 1 minute - that's all it takes to display a message to all employees.
- 20% - that's how much of their time an average office worker spends creating reports.
-
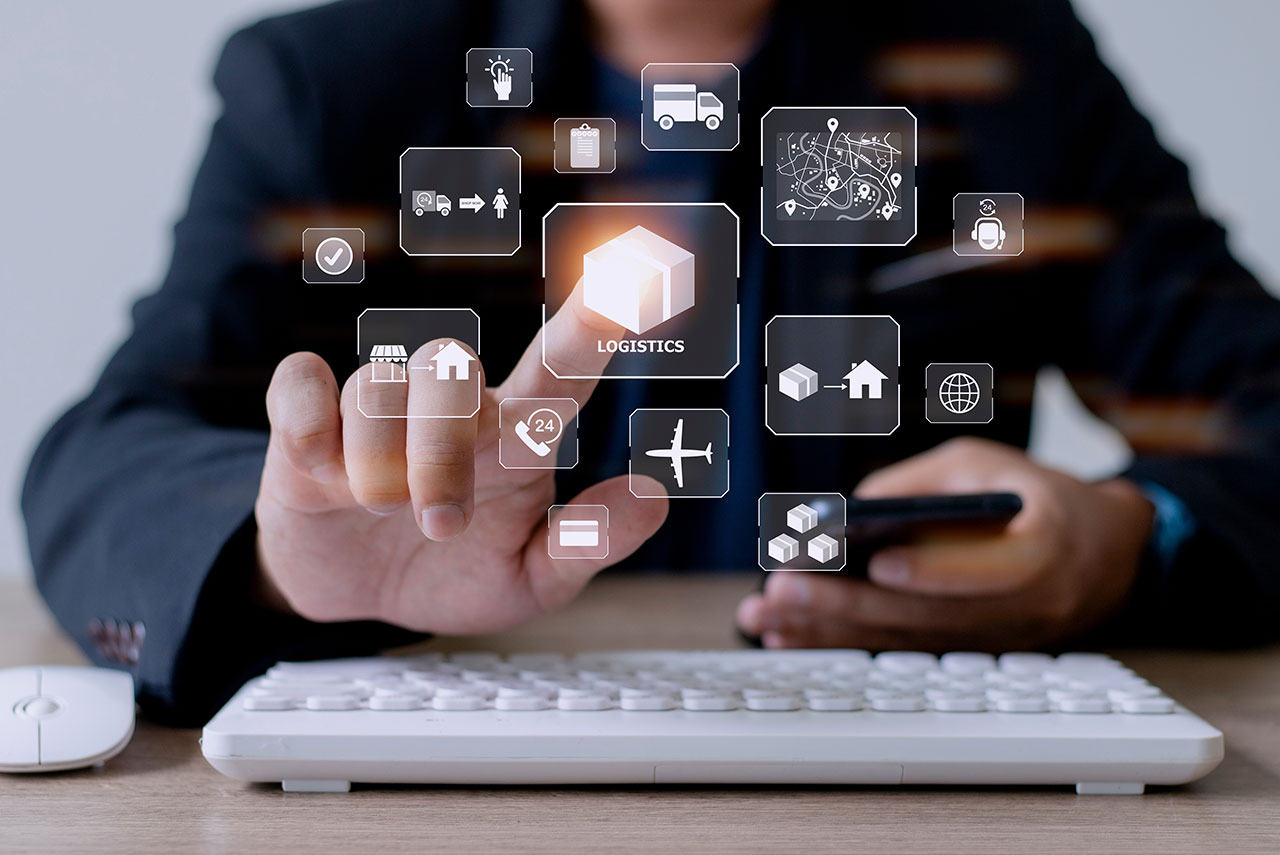
Only the most important information
The solution can be programmed to perform specific actions if certain conditions occur, e.g., displaying a board comparing the plan and actual performance from the previous day at the start of a production shift. With internet access, it can use publicly available data, such as weather forecasts or exchange rates.
- Automatic triggering of actions, messages, content.
- Conveying only essential information facilitates its understanding.


We support you at every stage of the project
-
We clarify user expectations and preferences. We develop the solution plan, determine the budget and how the teams will work. Diagnosis
 -
We create business concepts to meet user expectations. We combine creative approaches with service design methodologies and our implementation experience. Design
 -
We provide software and hardware solutions. We are responsible for the full range of installation and implementation. Implementation
 -
We make sure that the delivered solutions are reliable. We provide support in software and hardware maintenance and content administration. Maintenance
 -
We test and analyse the effectiveness of the developed solution. We improve and develop its potential. Optimisation